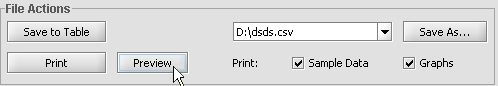
File Actions Panel
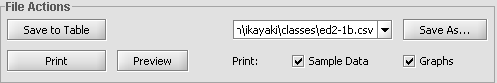
This panel provides options to save calculated components to a csv-file and to print sample data and graphs.
Saving sample data to a csv-file
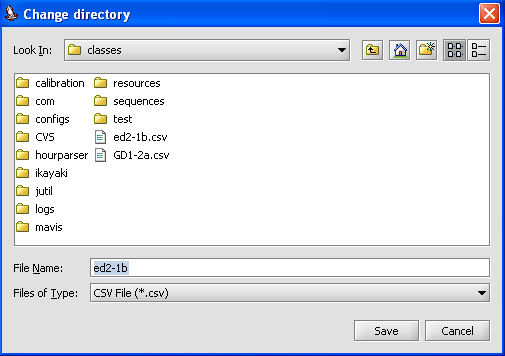
To save the calculated components data to a CSV-file you must first select the directory and a name for the file where the data is to be saved. This can be done by clicking the Save As-button or by writing the directory and filename to dropdown box. When Save As-button is pressed Mavis opens a save as-dialog.
Printing sample data and graphs
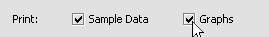
User is able to choose whether the printout will include sample data and graphs or just other.
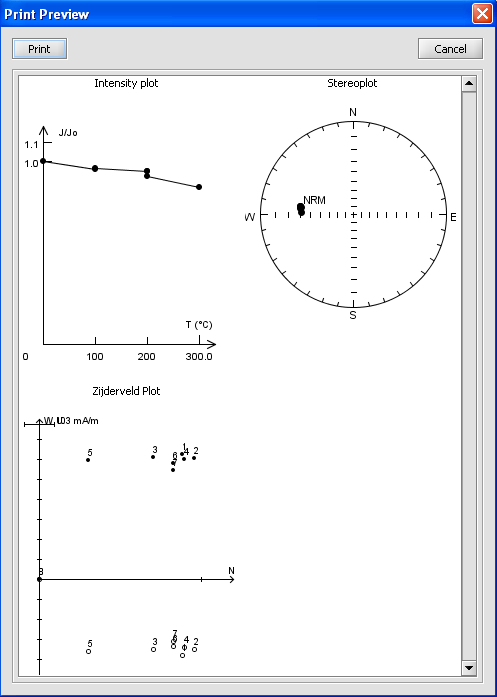
Previews of the prinouts can be seen by clicking the Preview-button. Mavis will open new windows that show the layout of the printouts (both, if both checkboxes are checked).
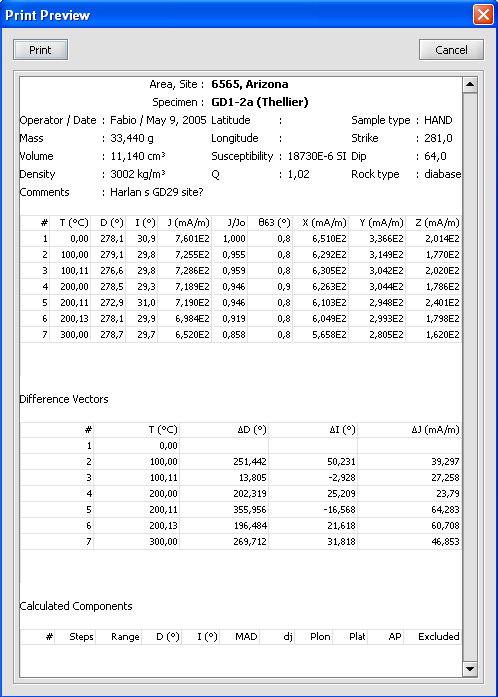
Below is an example of a sample data printout in a preview window.
Below is an example of a graphs printout in a preview window (included plots are: intensity plot, stereoplot and zijderveld plot). The two Zijderveld plots from graphs panel are combined for printout.