Graphs
Graphs panel includes different plot-types from which the user can visually analyse the measurement data. The available plot-types are intensity plot which is located in the top-left corner of the graphs panel, stereoplot which is located in the top-right corner of the graphs panel and two Zijderveld plots that are located in the bottom part of the graphs panel.
All plots scale automatically to the size that fits the current window-size. Graphs panel can be enlarged quickly by clicking the Project Explorer-tab from top-left corner of the Mavis window which hides all the other panels from the left-side of the program window.
The intensity plot and the stereplot are both features that can also be found from Ikayaki, but Zijderveld plots are new features.
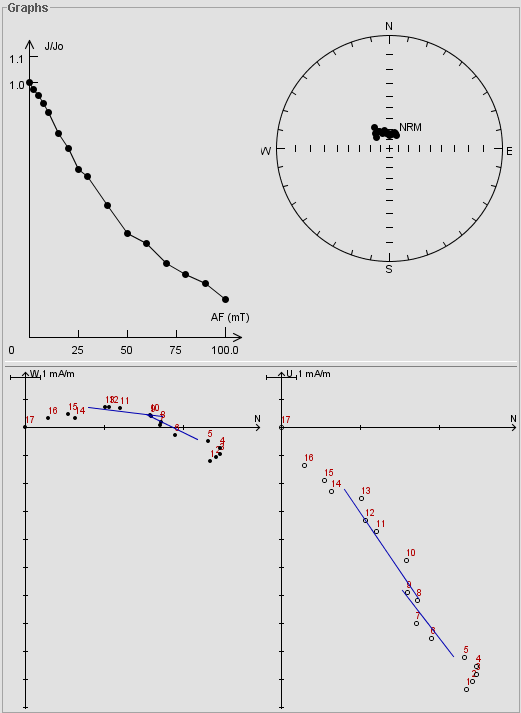
The purpose of the Zijderveld plots is to view the calculated magnetic components in two 2-dimensional projections. The calculated components will appear as purple lines in the plot. When project is opened to Mavis, all the measurement steps are drawn to Zijderveld plots as open/closed small circles and each is labeled with its step index.
Zooming the Zijderveld plots
Zijderveld plots can be zoomed by selecting the area to be enlarged by pressing the left mouse button down and dragging a box-selection over the area of interest.
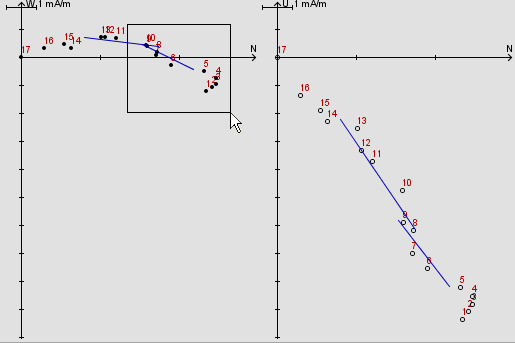
The area to be enlarged can be selected from either one of the plots, the resulting zoom-operation is always done to both plots.
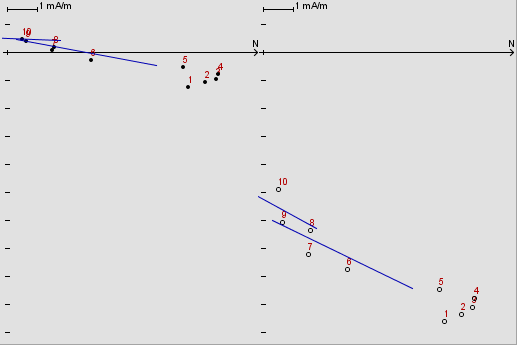
The view can be "zoomed out" by clicking the right mouse button as many times as needed.