Statistics
Personnel
Person-years in 2000-2005
| Personnel (person-years) | 2000 | 2001 | 2002 | 2003 | 2004 | 2005 |
| Teaching | 60.0 | 53.5 | 63.1 | 65.1 | 66.4 | 61.4 |
Professors |
9.6 | 12.1 | 12.3 | 13.2 | 13.4 | 10.8 |
University Lecturers |
12.8 | 14.2 | 17.0 | 17.9 | 18.3 | 19.7 |
Senior and PhD Assistants |
3.4 | 1.4 | 2.6 | 3.9 | 4.1 | 3.6 |
Assistants |
12.9 | 10.4 | 8.3 | 9.1 | 9.0 | 9.4 |
Full-time teachers |
4.4 | 4.2 | 5.3 | 6.1 | 5.2 | 3.4 |
Part-time teachers |
16.9 | 11.2 | 16.6 | 15.0 | 16.4 | 14.6 |
| Post-graduates | 14.9 | 17.7 | 17.1 | 16.8 | 15.7 | 18.5 |
| Researchers and research staff | 37.2 | 39.0 | 55.8 | 56.4 | 73.7 | 68.9 |
| Administration | 13.0 | 16.5 | 17.0 | 17.0 | 18.2 | 16.1 |
| Person-years total | 125.1 | 126.7 | 152.0 | 155.4 | 174.0 | 164.9 |
Person-years in re cent of funding sources
| 2000 | 2001 | 2002 | 2003 | 2004 | 2005 | Muutos edell. vuoteen (htv) | |
| Budgeted funding | 79.0 | 71.0 | 83.8 | 92.5 | 104.4 | 100.0 | -4.5 |
| EU Funding | 2.6 | 4.4 | 1.2 | 2.5 | 5.7 | 3.2 | |
| Paid Business Income | 10.7 | 8.7 | 15.8 | 9.7 | 11.5 | 7.3 | -4.2 |
| Other Ministry of Education | 11.4 | 13.2 | 12.7 | 8.9 | 0.0 | ||
| Academy of Finland | 9.5 | 14.3 | 25.7 | 23.1 | 25.9 | 20.9 | -5.0 |
| Communal Funding (e.g. Tekes) | 11.5 | 15.1 | 12.9 | 21.2 | 29.7 | 31.6 | 1.9 |
| University Funding | 0.4 | 0.0 | |||||
| Person-years total | 125.1 | 126.7 | 152.0 | 155.4 | 174.0 | 164.9 | -9.1 |
Average age and gender distribution of staff at the Department of Computer Science
| Gender distribution(%) | 2002 | 2003 | 2004 | 2005 |
| -women | 20.8 | 20.7 | 21.2 | 22.2 |
| -men | 79.2 | 79.3 | 78.8 | 77.8 |
| Average age in years | 32.8 | 33.0 | 33.8 | 34.6 |
| Foreign employees (%) | 10.3 | 10.9 | 13.0 | 10.4 |
Funding
| Funding (Million Euros) | 2000 | 2001 | 2002 | 2003 | 2004 | 2005 |
| Basic funding | 1.9 | 1.9 | 2.2 | 2.3 | 2.4 | 2.5 |
| Carried over from previous year | 0.0 | 0.9 | 1.4 | 2.6 | 3.4 | 2.4 |
| Additional funding/Directed spcial funding | 1.7 | 2.1 | 2.8 | 3.3 | 2.1 | 2.4 |
| Additional external funding | 2.2 | 2.1 | 2.8 | 3.0 | 3.4 | 3.5 |
| Total | 5.9 | 7.1 | 9.3 | 11.3 | 11.3 | 10.8 |
Implemented additional (external) funding
| Funding | 2001 | 2002 | 2003 | 2004 | 2005 |
| Academy of Finland | 0.6 | 1.2 | 1.1 | 1.2 | 1.0 |
| Tekes | 0.6 | 0.3 | 0.4 | 0.8 | 1.0 |
| Companis | 0.6 | 1.0 | 0.7 | 0.6 | 0.5 |
| EU | 0.2 | 0.1 | 0.0 | 0.2 | 0.4 |
| Other national funders | 0.1 | 0.5 | 0.8 | 0.7 | 0.6 |
| Total | 2.1 | 2.8 | 3.0 | 3.5 | 3.5 |
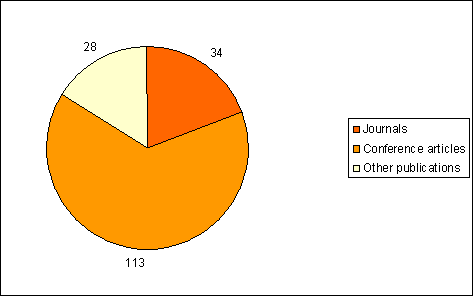
Publications
| 2000 | 2001 | 2002 | 2003 | 2004 | 2005 | |
| Books | 0 | 0 | 4 | 2 | 0 | 0 |
| Journals | 8 | 6 | 22 | 23 | 36 | 34 |
| Conference articles | 49 | 49 | 46 | 68 | 64 | 113 |
| Other publications | 50 | 42 | 74 | 41 | 31 | 28 |
| Total | 107 | 97 | 146 | 134 | 131 | 175 |

Studying and teaching
Student body
| 2000 | 2001 | 2002 | 2003 | 2004 | 2005 | |
| Admission quota | 270 | 235 | 235 | 235 | 180 | 180 |
| Freshmen registrations | 267 | 243 | 264 | 197 | 188 | 182 |
| Students chosen on the basis of earlier studies | 61 | 61 | 82 | 34 | 64 | 46 |
| Upgrading students | 81 | 78 | 71 | - | - | - |
| All regeistered students | 2110 | 2230 | 2351 | 2364 | 2462 | 2429 |
| Female students percentage | 20 | 20 | 19 | 19 | 19 | 19 |
Teaching
| 2000 | 2001 | 2002 | 2003 | 2004 | 2005 | |
| Completed credits | 19265 | 17971 | 17972 | 17591 | 16588 | 13806 |
| Credits completed elsewhere | 2257 | 6131 | 5011 | 4581 | 2331 | 1091 |
| Teachers in person-years | 60 | 54 | 63 | 65 | 66 | 61 |
| Credits/person-year | 321 | 333 | 285 | 271 | 251 | 225 |
| Students/person-year | 35 | 41 | 37 | 36 | 37 | 40 |
Degrees
| Master's theses and degrees | |||||||
| 2000 | 2001 | 2002 | 2003 | 2004 | 2005 | ||
| Master's theses | 63 | 75 | 70 | 60 | 73 | 65 | |
| Master's degrees | 64 | 61 | 72 | 60 | 68 | 82 | |
| Post-graduate degrees | 2000 | 2001 | 2002 | 2003 | 2004 | 2005 | |
| Licenciate | 5 | 6 | 4 | 2 | 7 | 3 | |
| PhD | 4 | 4 | 3 | 7 | 9 | 3 | |

