Explanation of binding site-expression tables

Here are described some of the numbers shown in the table and procedures to compute them.

Experiment
Name of the hybridisation experiment from Rosetta data. The drug treatments and the haploid experiments have been removed from the data . The link is to an entry of corresponding protein in Yeast Proteaome Database in www.proteaome.com
Total
Total number of genes having significantly altered expression.
%Pattern w. Significant
Percentage of genes having the pattern in their regulatory region, that have significantly altered expression. Prosenttiosuus poikkeavista geeneistä joilla on sitoumapiste säätelualueellaan.
Ratio
Ratio of percentage of significant significant genes in the specified set and percentage of significant genes in total.
%Significant w. Pattern
Percentage of all significant genes that have the regulatory pattern. Prosenttiosuus pisteen säätelemistä geeneistä joilla on poikkeava expressio.
P-value
Probability of observing a sample this extreme, or more, if the null hypothesis is correct.  The tablewise P-value is for Hypothesis:
H0: There is no errors in the table of tests.
H1:
There is at least one error in the table.

The P-value for the tests in the tables are for Hypothesis:
H0:
The genes in the set are independent of each other.
H1:
The genes in the set are dependent.
We test this hypothesis by assinging each gene g with random variable X g so that P(Xg=1)=p and P(X g =0)=1-p, p being computed from the data (complete set of tests).
Now we know by Central Limit Theorem that Y G =(sum of Xg:s)/#G over a random set G of genes, is approximately normal with mean u=p and variance s2=p*(1-p)/#G  so yg=(Y g -p)/s is standard normal (if Y g *#G and (1-Y g )*#G are both >5 )
With this we can compute P-value P(|z|>|y g|)
Corr
Definitions 
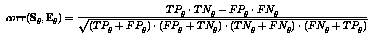
Correlation coeffiecient between the set of genes having the binding site and the set of genes having altered expression. Lets define the notions True Positive, True Negative, False Positive and False Negative (G=genes, S=genes w. site, E=genes w. altered expression). Now the correlation coefficient is
Formula

Multiple tests
When we do multiple tests at once, as we do in these tables, we have to pay close attention to our real p-value. For example, if we use p-value limit of 0.05 for three test, probability of type I error is 0.05+0.05+0.05=0.15  which is much more that we expected. This is why we have to adjust our test-wise p-values so we can control our table-wise p-value. Following formulas allow us to do that:

For independent tests with tablewise p for n tests: 1-(1-p)^(1/n)
For dependent tests (Bonferoni): p/n
Holm method for j:th test in ascending order of testwise p-values: p/(n-j+1)

The Holm method (see for example: Glanz, Slinker A primer of applied regression and analysis of variance) allows us to increase the discriminative power of multiple tests.


22.8.2001 Kimmo Palin