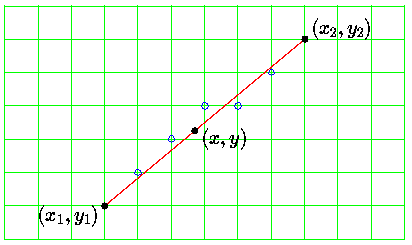
Even if a line segment has integral endpoints, the points which make up the interior of the line will, in general, be real numbers. A line is, in fact, a continuum of points, and a line segment is a continuum of points between endpoints. Thus, drawing on a raster display is a process of approximation. We try to pick those displayable points which give the best approximation to the real line.

In this image, for example, the mathematical line segment is shown in red, and the points on the raster grid which are chosen to approximate it are shown in blue. The grid of green lines shows the locations of the centres of the displayable points on this raster.
The points drawn are shown as small circles. These circles are meant to represent the centres of points. The points normally appear on the display as dots of a size such that two points next to one another touch. Drawing them like this tends to clutter up schematic diagrams, so I draw the centre positions only, with the understanding that the actual displayed points are much bigger.
In computer graphics applications it is important that line segments be draw as accurately as possible, but it is also important that they be drawn as quickly as possible. Thus, studying line-drawing in computer graphics involves the study of algorithms which give good approximations to lines but which are also efficient.
Since we want to generate points ``on'' (or at least near) the line segment, we need a way to describe which points belong to the line. Naturally this involves co-ordiante geometry.
There are many ways to represent the points belonging to a line, for example the well known:

This isn't a very good representation for our purposes: it makes no explicit mention of the endpoints, and it has problems handling lines which approach the vertical, as the slope tends towards infinity.
A better representation is this:

This has the advantage that the endpoints appear explicitly in the equation. Also, it is always possible to manoeuvre it so that infinities are avoided.
Best of all for the purposes of computer graphics is the following parametric form for the equation of a line (really, a pair of coupled parametric equations):

Infinities are impossible here. It is also clear that to generate a
``sufficient'' number of points for the line, it is only necessary to employ
a ``sufficient'' number of values for  between 0 and 1.
Here is a C++ implementation of a line-drawing routine which implements this idea in a direct way:
  void line(Screen &s,
            unsigned x1, unsigned y1,
            unsigned x2, unsigned y2,
            unsigned char colour )
  {
    const float dl = 3.125e-3;
    float l;
    int dx = x2 - x1;
    int dy = y2 - y1;

    for ( l = 0.0; l < 1.0; l += dl )
      s.Plot( x1 + int(floor(dx*l+0.5)),
              y1 + int(floor(dy*l+0.5)),
              colour );
  }
The way the incremental step size is chosen is interesting. Any line draw on
the VGA Mode 19 screen can be at most 320 points long and 200 points high.
Therefore, to ensure that no points are ever missed when a line of some
arbitrary length is plotted, we guarantee that the loop will make 320
interations by setting the incremental change in  (
( ), written as ``
dl'' in the program) equal
to the reciprocal of 320.
Although simple, this line drawing routine is inefficient:
Even given these limitations, this routine is the basis for all the line drawing functions to be developed in this section. Each new routine will attempt to ameliorate some of the problems displayed by this simple approach.
for loop. These operations are expensive and are actually
unneccessary in a line-drawing routine.
Instead of calculating the x and y values of each point
explicitly at each step, we observe that if we are at point
 in step i of the loop, then the correct new
values for
  in step i+1 are given by:

But  and
and  are constant quantities
within the loop, so only need to be evaluated once, outside the loop.
This gives a modified line-drawing function:
  void linev2(Screen &s,
          unsigned x1, unsigned y1,
          unsigned x2, unsigned y2,
          unsigned char colour )
  {
    const float dl = 3.125e-3;
    float l,
          x  = x1+0.5,
          y  = y1+0.5,
          dx = int(x2-x1)*dl,
          dy = int(y2-y1)*dl;

    for ( l = 0.0; l < 1.0; l += dl )  {
      s.Plot( unsigned(floor(x)),
              unsigned(floor(y)),
              colour );
      x += dx;  y += dy;
    }
  }
This is called a Digital Differential Analyser or, more commonly, a DDA. DDAs are widely used in computer graphics when complex terms can be calculated incrementally, as here.
The increments for x and y are usually referred to as
 and
and  . In the code these appear as
dx and dy.
This routine is not the entire solution however:
A C++ syntax point worth mentioning:
Note the explicit casts on subtractions. These are important to ensure that C++ doesn't think of the result of subtracting two unsigned numbers as another unsigned number. This is what it would normally do.
long values instead of
float values.
  void linev3(Screen &s,
          unsigned x1, unsigned y1,
          unsigned x2, unsigned y2,
          unsigned char colour )
  {
     unsigned l;
     unsigned long x = x1*320+160,
                   y = y1*320+160;
     int dx = x2-x1,
         dy = y2-y1;

    for ( l = 0; l < 320; l++ )  {
      s.Plot( x/320, y/320, colour );
      x += dx;  y += dy;
    }
  }
This is a real advance in efficiency over the previous example. Integer only
arithmetic is much faster than float-point, even on machines with
floating-point hardware. We have also dispensed with the expensive
rounding operations of the earlier example, the integer division by 320 is
now performing the same job as the floor function used earlier.
Note how the function rounds by adding the constant 160 (320/2) to the initial x and y values.
Even given that this routine is efficient, we still desire to improve its performace further. The presence of integer divisions in the inner loop of the function is something we would like to eliminate, because division is the most costly integer arithmetic operation.
Why do we scale bu 320? Simply to ensure that we can plot enough points so that the longest line visible on the display will have no gaps. Thus, any value greater thatn 320 will serve equally well as a scale factor. If we choose the scale factor to be the next largest power of 2, (i.e. 512), then the integer multiplications and divisions may be achieved with bit shifts, which are much more efficient.
Here is a DDA which does exactly that.
    void linev4(Screen &s,
          unsigned x1, unsigned y1,
          unsigned x2, unsigned y2,
          unsigned char colour )
    {
        unsigned l;
        unsigned long
            x  = (long(x1) << 9) + 256,
            y  = (long(y1) << 9) + 256;
        int dx = x2 - x1,
            dy = y2 - y1;

        for ( l = 0; l < 512; l++ )  {
          s.Plot( (x >> 9), (y >> 9),
                  colour );
          x += dx;  y += dy;
        }
    }
 and
and  , finding the next largest power of 2, and
using the reciprocal of this as the step size.
linev4 is asked to plot a line 10 units long, it will plot
each point 52 times.This is not so important from an efficiency viewpoint, because the calculations involved are so simple that they may easily be implemented in very fast hardware. Where it does become important, and a considerable problem, is when one is attempting to use exclusive-or mode writing into the display buffer. A routine which plots the same point many times when drawing a line is obviously not much use if the line is supposed to be ``xor'ed'' with its background. Thus, there is a need for line drawing routines which are guaranteed to plot each point eaxctly once.
It is fairly obvious that if  is chosen such that:

or:

Which to choose? To decide, let's investigate the effects of choosing
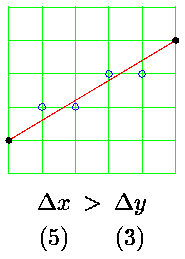
 for all lines. If we do this we find that this
choice works well for shallow slopes:

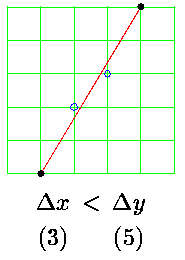
but fails miserably for lines with steep slopes:

In this case the line has gaps in it. Obviously we have to choose the reciprocal of the larger of the two differences as the step size. We must be careful, however, to make the comparisons on the basis of absolute values. This gives:

A routine employing this step size is shown here:
void linev5(Screen &s,
          unsigned x1, unsigned y1,
          unsigned x2, unsigned y2,
          unsigned char colour )
{
    int dx = x2 - x1,
        dy = y2 - y1;

    if ( dx || dy )  {
        if ( abs(dx) >= abs(dy) )  {
            float y = y1+0.5;
            float dly = float(dy)/float(dx);
            if ( dx > 0 )
                for ( int x = x1; x <= x2; x++ )  {
                    s.Plot(x,unsigned(floor(y)),colour);
                    y += dly;
                }
            else
                for ( int x = x1; x >= int(x2); x-- )  {
                    s.Plot(x,unsigned(floor(y)),colour);
                    y -= dly;
                }
        }
        else  {
            float x = x1+0.5;
            float dlx = float(dx)/float(dy);
            if ( dy > 0 )
                for ( int y = y1; y <= y2; y++ )  {
                    s.Plot(unsigned(floor(x)),y,colour);
                    x += dlx;
                }
            else
                for ( int y = y1; y >= int(y2); y-- )  {
                    s.Plot(unsigned(floor(x)),y,colour);
                    x -= dlx;
                }
        }
    }
}
Note how the routine is more complex than the ones looked at earlier. This is because of the large number of choices which it needs to make, whether to step over x or y, and whether to step forwards or backwards in x or y.
Note also that this routine is in one sense a retrograde step, it is using floating-point arithmetic again. We would like to be able to guarantee that each point is plotted only once, but only use integer arithmetic. We will address this in the next section.
Colin Flanagan / flanaganc@ul.ie