This is the user manual for the DaCoPAn Animator subsystem. The DaCoPAn Animator is one part of the DaCoPAn software tools. It is intended for use together with the DaCoPAn Analyzer or by itself.
The DaCoPAn Animator is a visualization tool used to animate TCP/UDP/IP/Ethernet protocols for educational and research purposes. It visualizes data communications using Protocol Event Files (abbreviated as PEF or PEF files) generated by the DaCoPAn Analyzer. Thus, it can be used as a tool to examine data communications in conjunction with the Analyzer or as an educational tool by itself. As an educational tool it can be used by a teacher or lecturer to show visualized network communications, or by students to explore strange new network phenomena.
This user manual covers only the Animator subsystem and thus a user who wishes to use the Animator as part of DaCoPAn tools should also read other relevant user manuals. However, for a user using the Animator only for educational purposes, this user manual should be quite adequate.
The DaCoPAn Animator was created and modified during the course of successive Software Engineering Projects at the Univesity of Helsinki. You have been warned.
The latest stable version of the DaCoPAn Animator is available from the DaCoPAn2 home page located at http://www.cs.helsinki.fi/group/dacopan2/Resources/. If you don't have Java installed, you need to install it before installing the DaCoPAn Animator. Follow instructions presented at http://www.java.sun.com/downloads/.
The latest source edition is also available for download from the same site http://www.cs.helsinki.fi/group/dacopan2/Resources/. You can compile the source using Ant, a free Java-based build tool, which can be found at http://ant.apache.org. It is possible to compile the Animator without Ant, but such is not covered in this document.
Note: The Microsoft JVM/JDK is not supported.
To build DaCoPAn from source under Linux follow the instructions below.
1. Unpack the source from the dacopan-animator-2.0-src.tar.gz file using the command:
tar zxvf dacopan-animator-2.0-src.tar.gz
2. Change the directory to the dacopan source directory at /dacopan/animator/main/.
3. To build the source, execute the command:
ant jar
The compiled version of the Animator should appear in the file _build/animator.jar. You can then execute it by typing java -jar _build/animator.jar.
The Animator can be run in some alternate ways. You can either run it from the command line by typing:
java -jar animator.jar
or by clicking on a shortcut (animator.sh in Linux and animator.bat in Windows).
To be able to use the Animator for anything productive, you also need to have some Scenario files or Protocol Event Files. To get them, you can either use the DaCoPAn Analyzer to create such files or go to the DaCoPAn distribution site and download predefined Scenario Files. Some example files are also delivered in the Animator distribution package.
In this section the different sections of the DaCoPAn Animator are briefly explained.
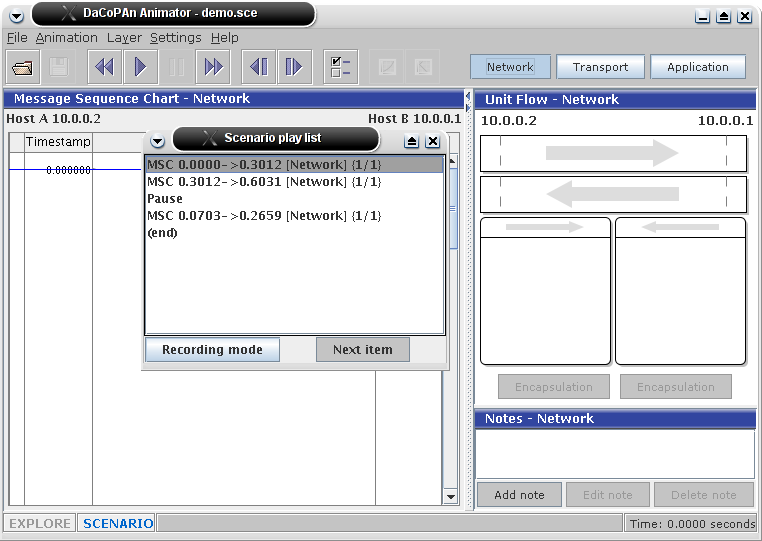
As you can see in the above image, the screen is divided into two main parts: the main area on the left and the secondary area on the right. In the main animation area there can be three kinds of animation panels: an ENC, MSC or TSC panel. The secondary animation area is split into two additional panels. The top panel contains either the UFO or Unit Info panel and the lower panel contains the Notes panel or tabbed Notes & Legend panel. In addition to these, there also is a toolbar and a statusbar. In Scenario mode you can also see a small window for editing and controlling the scenario, situated in the above picture on top of the main area on the left, which is explained in the scenarios section.

The menubar contains all the essential main functions of the program. For example, saving and loading files as well as controlling animation can be done through the menus. This online user manual is also located under Help - User manual.

The toolbar provides a fast way to access the most important actions available through the menus. These are the basic file operations, animation control, settings, animation view mode and layer change buttons.
The main animation area is used by either the ENC, MSC or TSC panel. Initially when the Animator is started, a welcome screen is shown in that space instead.
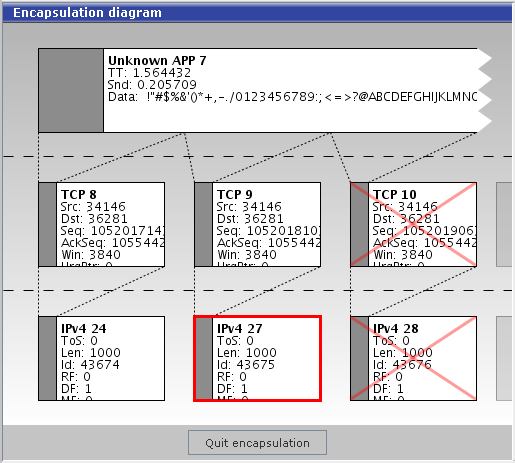
The Encapsulation (ENC) panel shows the encapsulation of a selected transfer unit. The selected unit is marked with a red border. To get out of the ENC view, there is a button: "Quit encapsulation".
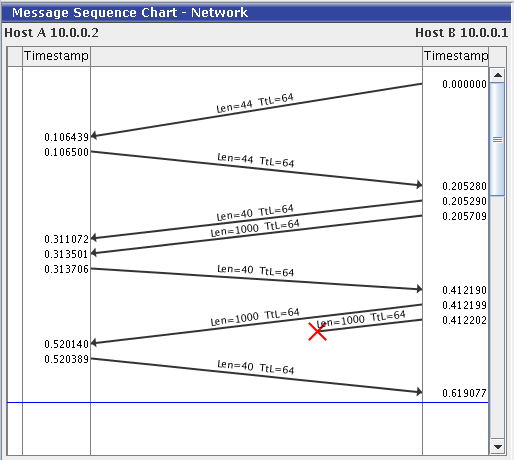
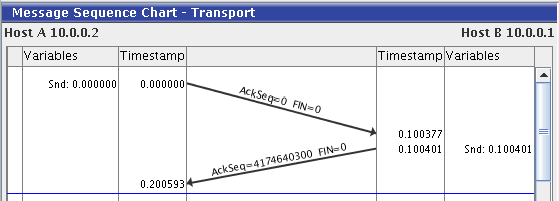
The Message Sequence Chart (MSC) animation view is one of the main animation types in the DaCoPAn Animator. It shows the units being transfered between two hosts, mapped along a time axis increasing from top to bottom. The panel is divided into a drawing area that shows the units moving as lines, between the hosts; and a host column area, which is mirrored on both sides of the main drawing area column, displaying timestamp values. Additionally, a second column can be selected to be displayed that holds information about host variables at specific times in animation. The gradient of the drawn lines gives some indication of the transfer delay between hosts. Above the drawn lines, protocol header fields can be selected to be displayed; these header fields are also all always displayed in the UFO panel. The current time in the animation is shown as a horizontal blue line called the "progress line".
The other panels which are associated with the MSC animation view are the ENC, UFO and Notes panels.
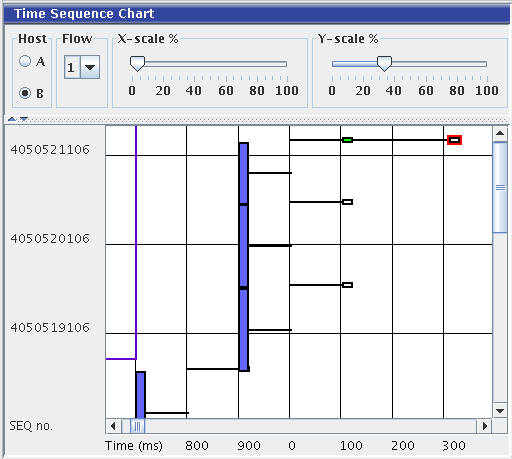
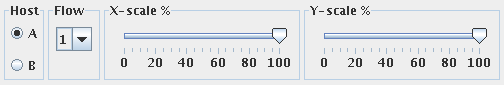
The Time Sequence Chart (TSC) animation view is the other main animation type in the DaCoPAn Animator. The main panel is divided into two parts, a separate toolbar and the drawing area. The toolbar has a host chooser button, flow list and two scale sliders for each axis. These settings are not replicated in the TSC specific settings in the separate settings dialog. The drawing area shows unit trasfers between two hosts depicted as a flow from one host, A or B, to the other. The unit transfers are plotted in increasing ladder-like steps. The vertical axis, increases from bottom to top, depicts the sequence number of the unit and the horizontal axis, increasing to the right, represents time. Therefore, the height of the steps indicates the amount of data transfered, and the length of the horizontal lines attached to the units indicate the transfer delay of the unit between the hosts.
The other panels which are associated with the TSC animation view are the Unit Info panel and Notes & Legend panels.
The secondary animation area is used by the UFO and Notes panel in the MSC view mode, and by the Unit Info panel and tabbed Notes & Legend panels in TSC mode.
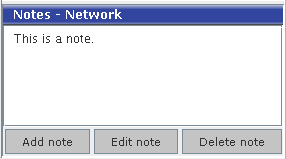
The Notes panel displays notes that can be attached to either time and layer (MSC panel), a specific encapsulation view (ENC panel) or to a specific event/unit (TSC panel). In MSC mode the Notes panel always shows the last note, whereas in TSC mode the note is displayed only if it is attached to the currently active unit.
The Notes panel can also be used for adding, deleting and editing notes.
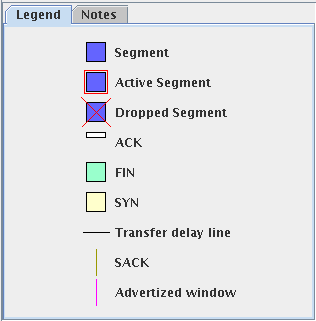
In the TSC mode there is a tabbed Notes & Legend panel. The notes functionality is just like in the MSC mode, as described above in the Notes panel subsection. The additional Legend panel tab explains the drawn graphical elements which are currently selected to be displayed in the drawing area.
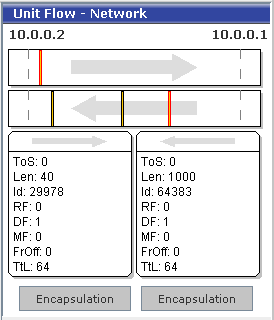
The Unit Flow Orchestration (UFO) panel visualizes the units moving in the MSC panel in a more visual way as boxes. It also displays the variables and protocol header fields which are associated with the currently active units travelling in both directions, which are highlighted. It is always used together with the MSC animation panel and when the main animation area is used by the ENC panel, the UFO stays empty.
In the TSC animation mode the panel space is occupied by the Unit Info panel, which is described below.
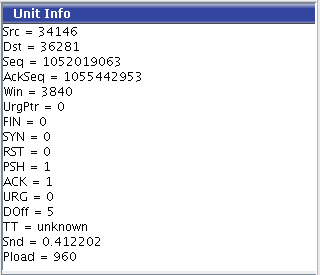
The Unit Info panel displays variables associated with the currently active unit seen highlighted in the main panel, drawing area, of the TSC animation view mode. See the TSC panel subsection above. These variables are, basically, the same as seen in the UFO panel in the MSC mode, if selected to be displayed. However, the TSC mode only shows transport layer data.

The status bar contains two important sections: On its left side, there is a display showing which Animator mode (scenario or explore mode) is currently active. The MSC supports both modes, whereas the TSC only supports the explore mode. The active one is highlighted and the other is grayed. On the right corner there is a panel displaying current time in the actual network communication animated. The timer is inactive in the TSC animation mode.
When the Animator is in scenario mode, the scenario playlist window can be minimized to the statusbar. Then it appears on the right side of the Animator mode display and by clicking the title, the window appears again.
In this section the handling of Animator files is briefly discussed.
The Animator works with two different types of files:
PEF files contain protocol data (packet data and information on other essential entities, such as hosts, protocols and network layers) produced by the Analyzer out of protocol logs created with tcpdump. These files can be opened and viewed in the Animator. However, as the contents of PEF files vary significantly from one file to the other the settings of the Animator often require tweaking before the data in the file can be visualized in a meaningful way. This applies specifically to the TSC animation view and the linear time scale mode in the MSC view.
For example, some PEF files may contain protocol units that are sent and received within a couple of milliseconds (as is the case in a local area network) and in other files it might take the units several hundred milliseconds to arrive (modem connection to the internet, for example). Specifically in the MSC view if the linear time scale mode is used it's often necessary to adjust the visual scale -setting of the Animator to make the information on the units readable.
Any changes made to Animator settings can be saved in a separate settings file named .dacopan. However, Scenario Files store the selected user settings separately from the settings save file. A Scenario File also contains the sequence of animations recorded by the user as well as any notes attached to the animations.
Both PEF and Scenario Files can be loaded using the same procedure. To bring up the dialog for choosing which file to load, you should either
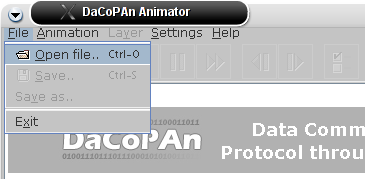
Image 1: Accessing the file selection dialog
After the file selection dialog has opened, you can set the file filter either to show PEF files, Scenario Files, both PEF and Scenario Files or all files.
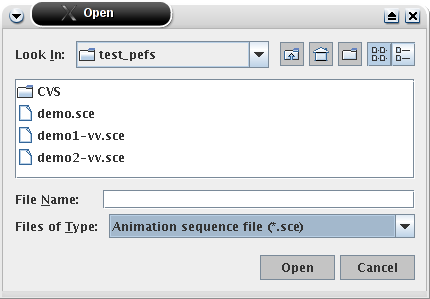
Image 2: Selecting a file
To load a file, double-click on it, or select it using a single mouse click and then press the Open button. When the file is being loaded, a progress dialog is shown (see Image 3).
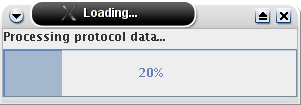
Image 3: Progress dialog
If no errors are reported, the file was valid and the Animator is ready to run.
When any changes are made to a file (either a PEF or a Scenario File) loaded into the Animator, the name of the file shown in the titlebar of the application is suffixed with an asterisk, that is the '*' character (see Image 4).

Image 4: The asterisk indicates a file with unsaved changes
As explained in the previous chapter, the Animator only saves Scenario Files. If any changes are made to a PEF file, they need to be saved in a new Scenario File. To save a PEF file to a Scenario File, you can either
This will bring up a file selection dialog similar to the one used when loading files. Use the dialog to type in the name of the Scenario File you'd like to create (or select an existing file to overwrite it). See Image 5 for an example.
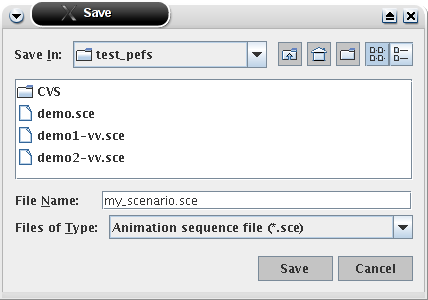
Image 5: Typing in the name of a new scenario file
If a Scenario File is already loaded into the Animator, accessing the Save... menu item or activating the Ctrl+S hotkey automatically saves the latest changes to the existing Scenario File. It is naturally also possible to save the scenario to a new file. To do this, you must select the Save as... menu item from the File menu.
The DaCoPAn Animator can be tuned to adapt it to the different user purposes. The setting panels are the interface for the user to set the Animator parameters.
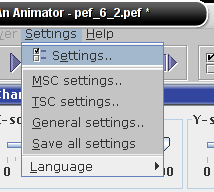
There are two ways to access to the setting panels:
From the main toolbar by clicking on the icon for the settings
![]()
From the menu: File - Settings
There are some different types of settings depending on their functionality. They have been divided into separate groups under three basic categories listed on the left side of the settings dialog window below, which are discussed in the further subsections.
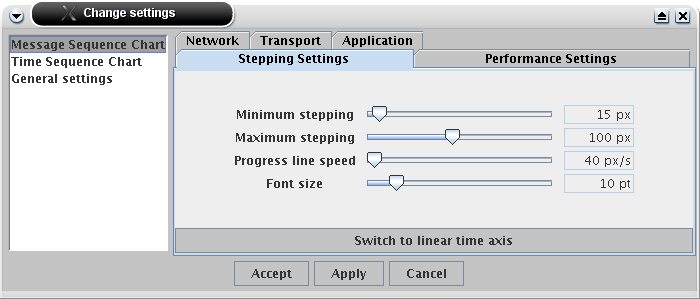
The menu list on the left side is always present in the settings dialog window in addition to the three buttons located on the bottom of the window.
The buttons have the following logic:
Accept - Commit all the changes made in the settings and close the settings window.
Apply - Commit all the changes made in the settings, but do not exit the settings window.
Cancel - Rollback any changes made in the settings and exit the settings window.
The general settings panel contains the language and management settings. At present the Animator is implemented only in English, with a partial localization in Finnish.
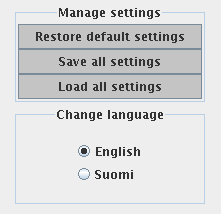
The settings management has three buttons. The buttons have the following logic:
Restore default settings - Restores the default settings of the Animator, which have been predifined (factory defaults).
Save all settings - Saves all the current settings that have been assigned into the .dacopan save file located in the user's home directory. If the file doesn't exist it will be created.
Load all settings - Loads the settings that are stored in the .dacopan file. If the file doesn't exist no changes are made to the current settings.
The settings for the MSC animation view are described in the sections below.
Linear time scale
Non-linear time scale
There are two additional animation scale modes within the MSC view mode. These are the 'linear time scale' and 'non-linear time scale' modes. The linear time scale mode is a remnant from the previous DaCoPAn project. It displays the drawn lines against a 'real' time y-axis scale. The non-linear time scale on the other hand displays a slightly distorted, but clearer picture of the drawn animation, which is not synchronized with the animation time.
The mode change buttons, as seen below, are located just above the three main buttons of the settings window in the MSC animation view with only one being active at a time. Each mode has separate scale settings, which are covered in the further subsections Scale settings and Stepping settings.


The MSC animation lets the user to show some information about the network units while the animation is running. There are two types of data that can be shown in the screen: variables (host-dependent values that are changed during the network transactions) and protocol header fields (value extracted from the header of a message exchanged in the network).
Protocol header fields and variables are values specific to a layer, so the Animator creates a panel per layer to select the fields and variables to display. These selection are made through two separated lists that contain the different variables and fields for the different protocols in that layer. The layer settings panel can be seen below.
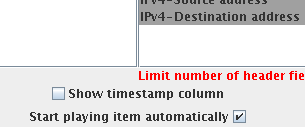
These selections are made by single-clicking on the different items in the list. No group selections are allowed. To deselect an item just single-click it again. Due to screen space issues when drawing the animation the number of variables and header fields that can be shown has been limited. The actual limits for them are 3 variables and 6 protocol header fields. If this limits are reached a message is displayed, as you can see in the figure.
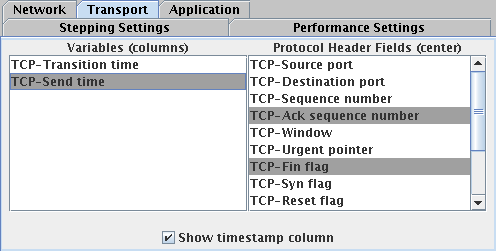
The variables and protocol header fields are displayed in different places in the MSC animation. The variables are shown in the columns every time that a message unit is sent or received (message unit event). The protocol header fields are displayed over the lines that represent the message unit.
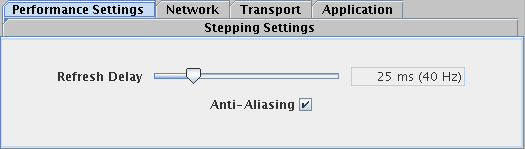
These settings let the user select the load of the Animator over the system in wich is running.
The scale settings are part of the linear time scale modes settings. Adjusting any of the scales will, however, also affect the scale settings in the non-linear time scale mode. This is considered to be a feature, which the user should be aware of.
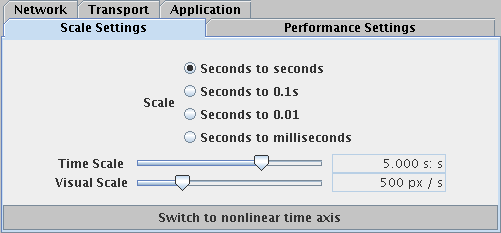
Setting up the animation display size and the speed of it are the most basic features of the animator and the user will need to tune them often to get the visualization. The scale settings panel contain some elements that will made easier to adjust these values.
The stepping settings are part of the non-linear time scale modes settings. Adjusting any of the scales has no affect on the linear time scale mode.
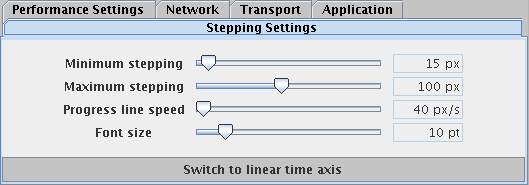
The Stepping settings panel contains four sliders, which have the following logic:
Minimum stepping - The minimum stepping is the minimal spacing that is forced between each adjacent pair of events on the y-axis. The minimum spacing has priority over the maximum stepping, which is defined below. The stepping is measured in pixels.
Maximum stepping - The maximum stepping is the maximum spacing that is allowed to exist between any two events on the y-axis. If the maximum stepping conflicts with the minimum stepping, then the maximum steping distance is always increased. The stepping is measured in pixels.
Progress line speed - The progress line speed controls how fast the animation proceeds. The speed is measured in pixels per second.
Font size - Font size adjusts the font sizes of all variables, header fields and column data in the drawing area. The font size is given in points.
The settings for the TSC animation view are described in the sections below.
The Animation settings control the speed of animation for the drawn graphical elements in the drawing area.
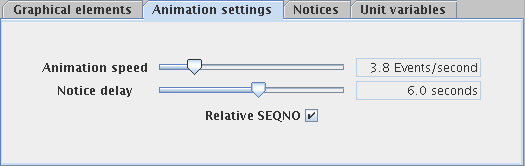
The Animation settings panel contains two sliders and a checkbox, which have the following logic:
Animation speed - The rate at which events are drawn in the drawing area, measured in events per second.
Notice delay - The delay in seconds, pause in animation, after a notice has been drawn.
Relative SEQNO - Toggles between the relative and absolute sequence numbering for shown units.
The Graphical elements settings panel allows the user to select which graphical elements are displayed in the drawing area, as well as the colors for the given elements.
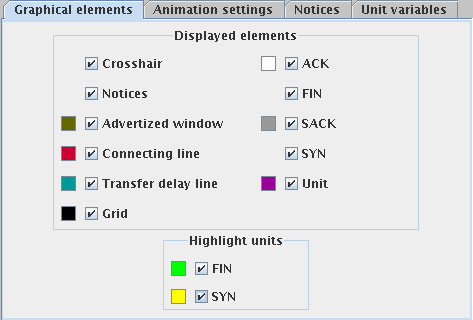
The Graphical elements panel contains two groups of buttons and checkboxes. The two Highlight Unit checkboxes have a separate logic from the other checkboxes. The other components, which affect different graphical elements, have the same functional logic:
Button - Opens up a JColorchooser dialog, from which the color for the graphical element can be chosen.
Displayed Elements : Checkbox - When selected the elemets are visible. Unselecting the checkbox causes the graphical elements to disappear from the animation view.
Highlighted Units : Chechkbox - When selected the FIN and SYN units are highlighted in their selected color scheme. When unselected the units convert to the same coloring as seen on the Unit button in the Displayed elements frame.
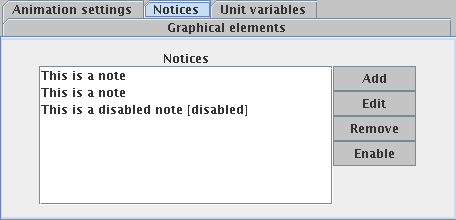
Notices are little note balloons in the TSC animation, which are automatically displayed for a transfer unit when the test condition of the notice is true for the transfer unit.
In the Notices settings panel, the triggers which cause automatical notices to be displayed on units can be managed. The Notices settings consists of a list of all the notices, with the notice text displayed on the list. If a notice is disabled, the text [disabled] is written after the notice text.
New notices can be added with the Add button. When a notice is selected using the mouse, it can be edited by clicking the Edit button, disabled or enabled by clicking the Disable/Enable button, and removed by clicking Remove.
Disabling a notice prevents it from being shown on the animation.
After clicking the Add or Edit button on the Notice panel, a dialog window for editing a notice appears, as seen below. The dialog consists of four editable fields. In the Notice text field the text to be displayed when the notice is triggered in the animation can be edited. The Variable field is a list where all the possible transfer unit variables are displayed. After selecting a variable, for example "Sequence Number", a test for the variable can be selected from the list. All tests except the "Exists" test require a numeric value to be entered on the Value field. The value can be given as a simple integer, a decimal number, or in scientific floating point value format.
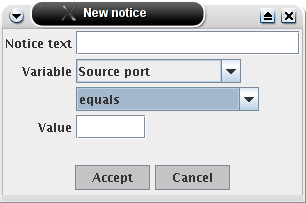
There are six kinds of tests available. "Equals" checks if the chosen variable for the transfer unit equals the given value. "Is greater than" is true when the value of the variable is greater than the given value, and so on. An exception is the "Exists" test which simply tests if the variable is available for the unit in the first place.
Note that currently only the "Exists" test is available for Selective Acknowledgment variables, since it's values are not numbers. Other kinds of notices for SACK variables are simply not displayed on the animation.
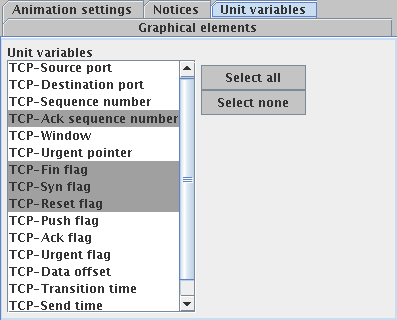
In the Unit variables settings, the TCP variables which are shown on the Unit info panel on the right side of the window in the TSC animation can be chosen. The selected variable names and their values are written in the Unit info panel for the active unit.
The panels displayed to change the settings are different depending on the working mode of the DaCoPAn Animator, due to the different purposes of the two modes.
In the explore mode the complete set of settings can be configured, these are all the settings listed above under the subsection Types of settings.
A smaller number of settings can be configured here. This limitation applies only to the MSC animation view, as the TSC view doesn't support the Scenario mode. Due to the purpose of creating a item for the Scenario play list, only the settings needed for one of those items is displayed:
Another place where the setting panels can be invoked is from the recording mode of the scenario playlist. In the scenario playlists the MSC elements settings can be edited by pressing the edit button. The panels open to edit the element settings are the same as the ones for the scenario mode but the values changed are the ones that the MSC element contain.
The animation is controlled either through the toolbar or commands in the menu. The basics of animation controlling are presented in this section.
 |
 |
When an animation is loaded in the Animator, it is in a paused state. In this state you can scroll the MSC area and step to specific places in time by clicking on the drawing area of the MSC panel. Similarily in the TSC view you can click on units in the drawing area to progress to specific events occuring at varying times.
When you want to watch the animation as a continuos stream of events, you can just click on the "Play" button. While the Animator is playing the animation, most other buttons than "Pause" become grayed, and if you want to do something else than just watch the animation, you must first press "Pause".

When the animation is paused, you can use the stepping buttons to step in the animation. In the MSC animation view the stepping moves the 'blue' progress line to the next or previous event depending on the direction in which you are stepping. In the TSC animation view the stepping moves the 'red' active unit border to the next or prevous event in a similar fashion. The different events for the animation are: sending a unit, receiving a unit or a unit being dropped.
 |
 |
"Rewind" and "Fast forward" buttons can be used to move to the beginning or to the end of the animation in the MSC or TSC mode.
The encapsulation (ENC) panel for a specific unit can be displayed by highlighting the unit in the UFO panel. In upcoming versions of the Animator it will be possible to select the unit by clicking on it, but at the moment you need to use the stepping functionality to find the unit you want to highlight (the newest unit is always highlighted).
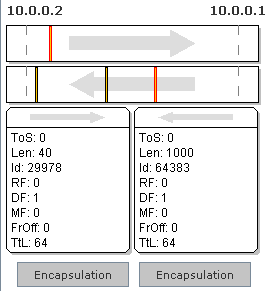
In the above picture, in the upper channel, you can see that the unit is highlighted and it's data is shown on the left data area. On the second channel moving from right to left, the last one is highlighted: it has a 'red' border and it's data is shown on the right data area.

When you have selected the unit whose encapsulation you want to see, you can show it by clicking on the "Encapsulation" button under the data area for that unit.

The change layer buttons are used to change the active layer which is being observed in the MSC view. The layers are: network, transport and application.
The host chooser button selects which hosts, A or B, network traffic is being displayed in the animation.
The flow list is used to select which flow of the network traffic is to be displayed in the animation. A PEF file may have several different flows, that is network connections.
The scale sliders are used for scaling the drawn animation.
In this section the 'Scenario mode' and working with scenarios are explained.
A scenario is a 'play list' of different items. You may get a scenario as a ready-made Scenario File (extension .sce) or you can create your own scenarios.
To work with scenarios you need to be in 'Scenario mode'. The program is always either in 'Explore mode' or in 'Scenario mode'. You can switch between the modes at any time, regardless of what kind of file you have loaded, while not in the TSC animation view; as the Scenario mode is not implemented in the TSC mode. You switch the mode via the Animation menu, see the picture below.
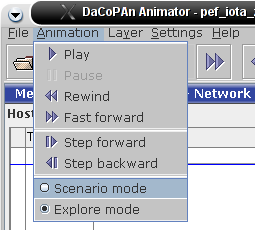
You can always see the mode you are in by looking at the bottom left corner of the DaCoPAn Animator window. When you are working with the Animator, either the explore or the scenario text is always highlighted with a blue color. This indicates the currently active mode.

The only difference between the modes is that in Scenario mode you have the 'Scenario play list' dialog where you can select scenario items for viewing. Aside from this dialog, in both of the modes all other controls available to the user work in exactly the same way.
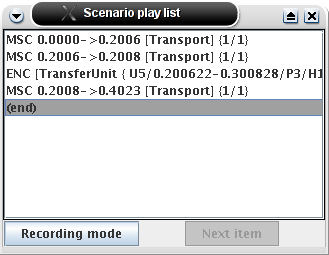
The Scenario play list dialog shows the Scenario play list and provides ways for showing and editing the list. When the application is in Scenario mode, the Scenario play list dialog is always either visible on screen or appears as minimized in the statusbar (see the picture above in previous section). So, in Scenario mode, the dialog is never completely hidden from view. If the dialog is minimized in the status bar, you can always make it visible by simply clicking on the blue rectangle with the text "Scenario play list".
If you just want to view scenarios, make sure you are not in recording mode. In the image below you see two versions of the dialog. The version on the left has recording mode off and the one on right has recording mode on.
 |
 |
You can always (when not in recording mode) select an item from the list for viewing. The list is intended to be presented from beginning to end. So, unless you want especially to inspect some item on the list, it's most logical to start from the beginning (top). You can always advance to the next item by clicking on the "Next item" button. When one item is presented, the program will automatically move to the next item on the list. Depending on what kind of items there are on the list, and some settings for those items, the list may play all the way from beginning to end without user input; or the scenario may require that the user presses the "Play" button (in the toolbar) or the "Next item" button (in the Scenario play list dialog) for some of the item. For more details, read about the different scenario items in the next section.
An MSC item means a presentation of the protocol data on the Message Sequence Chart. An MSC item is presented in the play list in this fashion:
MSC 0.3137->2.0061 [Transport] {1/10} AutoPlay
An MSC scenario item contains information about the following:
Start time - A point in time where the presentation of this item starts. In the above example the start time is 0.3137. When the item is selected from the list, the animation time is set to match this time.
End time - A point in time after the start time. In the above example the end time is 2.0061. When the animation is played to (or past) this time, the scenario will automatically advance to the next scenario item. Note that when the item is being recorded, it will exist in such a state that it has a start time but no end time. To mark this the end time is shown just as * (an asterisk).
Layer - Always just one layer where to present the data. In the above example the layer is Transport.
Settings - All the settings that you can access in scenario mode by the Change settings button (in toolbar) or the "Edit item" button (in Scenario dialog, only in recording mode) will be saved for the item. The settings are saved independently for each list item, so changing settings for one item doesn't affect the settings for any other item. The settings include the scale settings, the visualization settings for the particular layer, and also the 'AutoPlay' setting that is relevant (and available) only in the scenario mode. As an indication about these settings, the above example line has the part "{1/10}". This indicates the magnitude of the scale in the time linear mode, and corresponds to the radio button selected in the scale settings.
Meaning of the AutoPlay settings: (notice the text "AutoPlay" in the above example line) When AutoPlay is selected, the item is automatically put to Play mode when selected. (Selecting can happen either when the user clicks the item with the mouse, or the scenario advances to that item from the previous item.) Notice that the AutoPlay does not have effect when the scenario dialog is in recording mode. This is to make it easier to edit the play list.
ENC itemAn ENC item corresponds to an encapsulation of a selected unit. As a scenario item the ENC item is very simple. When the item is selected, the animator will present the encapsulation for the selected unit, and wait for the user to select the "Quit encapsulation" button. When that is done, the scenario will move to the next scenario item. Or alternatively the user can select the "Next item" button from the Scenario dialog, or just select another item from the play list. The are no editable settings associated with an ENC item.
Pause itemA pause item is a 'non-showable' item in the sense that selecting it doesn't cause any change in the visualization mode of the Animator. So when a pause item is selected from the play list, what you will see corresponds always to the previous 'showable' item that was selected. (Be aware that if you have selected the "Pause item" by clicking it on the list, the 'previous' item is not necessarily the one directly above the pause on the list, it is the item that was selected before you clicked the "Pause item", whatever the previous item was.)
The only functionality of the pause item is that when the "Pause item" is selected, it pauses the currently playing animation and moves it to the end time of the previous scenario item. (See note above for what exactly is the 'previous' item.)
You may want to use a pause item in the list after an MSC item if you wish the presentation to pause before, for example, changing layer or going into encapsulation. By using the pause item you can have the program pause so that the end of the previous MSC item is still visible.
End marker item - "(end)"This item behaves in much the same way as the pause item. There is always exactly one end marker in the play list - at the end. What is it for? Always, when you add a new item to the play list, it is added before the item that is currently selected. So, if you want to add something as the last (real) item in the list, you need to select the end marker and then add your item.
Most of what you need for recording your own scenarios has already been told previously in this subsection. This section will concentrate of some this-far-unexplained features of the recording mode.
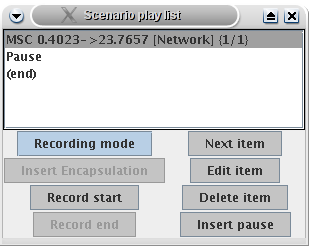
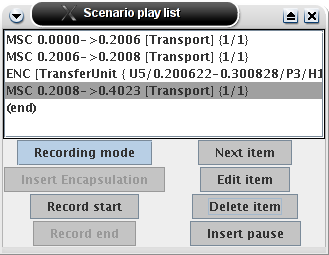
When you are in recording mode, your Scenario dialog will look like the dialog on the right below:
The buttons have the following functionality:
Recording mode - Toggles the recording mode on and off.
Next item - Advances to the next item on the list.
Insert encapsulation - Inserts the currently visible encapsulation (only available when one is visible) to the current position in the play list. (Also see the 'Automated recording actions' section below for another way of recording ENC items.)
Edit item - Shows the settings dialog for the current MSC item. Only available when an MSC item is selected.
Record start - Inserts a new MSC item, with the current time as the start time of the item. Only available in MSC mode and only when there are no unfinished MSC items on the list.
Record end - Sets the current end time as the end time for the currently unfinished MSC item. Only available in MSC mode and when there is an unfinished item. If the current time is before the start time of the unfinished item (end time cannot be before start time!), an error message is shown.
Delete item - Deletes the currently selected item.
Insert pause - Inserts a pause in the current position in the list.
Always when you are in recording mode, the following recording actions are carried out automatically:
A new MSC item is recorded when you press "Record start" and then "Play" - Whenever you press the "Play" button, a new MSC item is added to the current position in the list.
Encapsulation will be inserted when you press "Encapsulation" - Whenever you press one of the "Encapsulation" buttons inside the Unit Flow panel, the encapsulation is inserted in the play list as if "Insert encapsulation" had been pressed.
Finishing unfinished items - Whenever you have an unfinished MSC item on the list (MSC item without an end time) and you try to insert a new item in the list (either explicitly or implicitly), or change the layer, the program will try to record the current time as the end time for the unfinished item. If this is not possible, an error message is shown and the action you attempted to perform is cancelled.
These automated actions aim at making the recording of scenarios more intuitiveand effortless.
By using the Pause items and the AutoPlay settings it is possible to flexibly create scenarios with quite different paces. Using plenty of the AutoPlay you can make scenarios that play from beginning to end with the only necessary user interaction being pressing the "Quit encapsulation" button to get out of ENC mode. Using plenty of the Pause item and not using the AutoPlay feature makes it possible to create scenarios that wait for user actions (either the "Next item" button or the "Play" button, depending on situation) before any changes in the mode happen.
Further extended information about the DaCoPAn Animator can be found at http://www.cs.helsinki.fi/group/dacopan2.
[ACK packet]: ACK packets are used to acknowledge the receipt of a packet in the Transmission Control Protocol (TCP). They are used by both ends of the connection to move in between states, and are the basis of TCP's reliability.
[Analyzer]: A module of the DaCoPAn project. It reads and analyzes packet trace files and produces a protocol events file (PEF) as its output.
[Animator]: A module of the DaCoPAn project. It reads protocol events files (PEF) and scenario files (SCE files), and animates the protocol exchanges using various parameters. Its main use is as a teaching tool to instruct students on protocol basics found in the protocol event file.
[balloon]: See notices.
[DaCoPAn]: DaCoPAn stands for visualization of Data Communication Protocol through Animation.
[disappearing unit]: See dropped packet.
[dropped packet]: A unit which has vanished during the course of network transmission.
[drawing area]: The section of the MSC and TSC animation views where the actual network data is visualized and animated.
[ENC]: An abbreviation for the Encapsulation view. The Encapsulation (ENC) panel is one of four animation views which the software can display.
[event]: The occurance of a protocol exchange. For example, an event can be the sending or receiving of a unit.
[header variable]: Various TCP or other network layer variables which are contained in the transfer unit header fields.
[MSC]: An abbreviation for the Message Sequence Chart view. The Message Sequence Chart (MSC) panel is one of four animation views which the software can display.
[notices]: Notices are automatically generated by the TSC view based on various events in the PEF file and displayed inside small rectangles in the notice bar.
[notes]: Notes are free format textual information that can be added, edited and removed freely by the user. Both the MSC and TSC animation views contain a separate notes panel.
[PEF]: The abbreviation stands for Protocol Events File, and is synonymous with the term PEF file and PEF files, as used throughout the document. It is an output file generated by the Analyzer and read by the Animator. It contains data about the network traffic that will be animated by the Animator.
[progress line]: The blue horizontal line in the MSC panel, which scrolls down the view as the animation proceeds and reveals transpiring events as they unfold.
[SACK]: Selective Acknowledgment. An optional TCP feature which allows the receiver to specify which segments it has received and which ones require retransmission.
[Scenario File]: A native file written and read by the Animator. It contains all the data from a protocol events file and additional data related to how the scenario can be presented to the user, including notes and breakpoints.
[SCE file(s)]: See Scenario File.
[sequence number]: Every segment of data sent over a TCP connection has a sequence number. The sequence number is the number of the first data byte in the segment.
[SEQNO]: See sequence number.
[TSC]: An abbreviation for the Time Sequence Chart animation view. The Time Sequence Chart (TSC) panel is one of four animation views which the software can display.
[UFO]: An abbreviation for the Unit Flow Orchestration view. The Unit Flow Orchestration (UFO) panel is one of four animation views which the software can display.
[unit]: A transfer unit, which refers to all logical units that are transferred regardless of network layer. Thus, a unit can be an IP packet, a TCP segment or an application layer message.
Last modified on 6.5.2005