3
0 1
2 0
200 200
124 560
230 420
Three Concepts: Utility | Projects
Automatic graph layout on 2-dimensional plane for visualization is a relatively hard problem. The goal of the visualization is to present the graph in an understandable and clear format that facilitates its interpretation. Some issues to consider are, for instance, minimization of the number of crossing edges, minimization of edge length and the distance of nodes, retention of the existing hierarchy, etc.
Your task in this projects is to
Note, you cannot or need not assume that the input graphs have a meaning or some underlying structure, say a hierarchy, circularity, or symmetry. In other words, your goal is not to come up with a graph layout of a certain form, for instance, circle or face, but make the graphs readable and visually appealing for human eye.
Your program should run in CS Department Linux system. As an input, your program gets an ASCII file in which the first line indicates the number of nodes in the graphs and the following lines lists the (undirected) edges (pairs of nodes separated by white space, one pair per line). Your program should then print out a list of node centers' xy-coordinates, one coordinate-pair per line.
The visualization program used to judge the layouts is available here.
You can use this set of graphs to test your payoff function and search program.
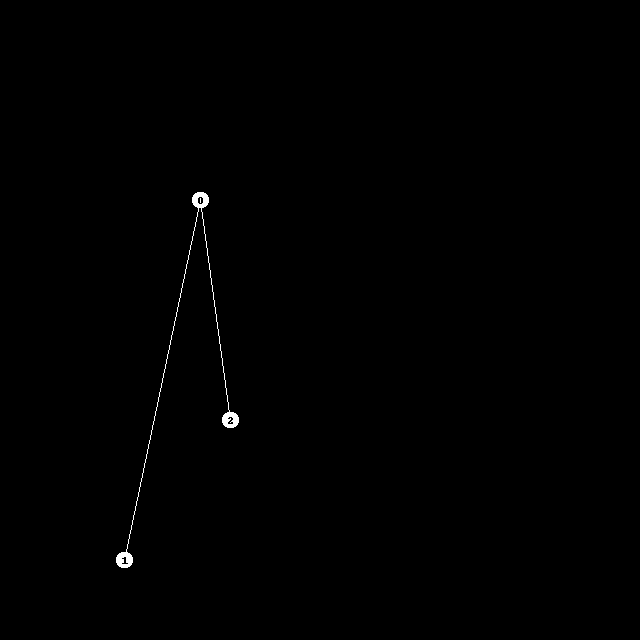
The drawing area is 640x640 pixels, the point (0,0) being in the upper left corner and the point (639, 639) in the lower right corner. The nodes are drawn as circles (radius 8 pixels) with white color. The index of the node (counted from 0 on) is drawn with black color in the center of the node. The edges are drawn with white color as straight lines of width 1.
An example input file of two edges (0-1) and (2-0):
3 0 1 2 0 |
|
An example output file:
200 200 124 560 230 420 |
Your program will be given tasks with up to 100 nodes, and it should not take more than 2 minutes to perform one task.
| Three Concepts: Utility | |