
Assignment 4: Ant colony optimization
This week your task is to familiarize yourself with ant colony
optimization (ACO), and apply the method to the problem described
below. Readings on ACO can be found in the course folder.
Trail planning
Recreational management is a job of controlling the access to
nature parks (e.g., parking lots, roads and trails, visitor centers
and campgrounds) and designing the facilities so that the number of
visitors and the quality of their experience is maximized without
excess crowding in any specific location, significant damage to the
natural environment, or conflicts between different park users (e.g.,
hikers, mountain bikers, rock climbers). Traditionally park managers
have used user surveys and traffic counts, but are increasingly
relying on computer simulations to estimate the facility requirements.
Task description
Let us assume that there are only one type of users in the park,
hikers. Your task is to assist the park manager in planning efficient
hiking routes from the park entrance to the natural monument, located
in the other end of the park, using ant colony optimization.
Your first task is to design a utility function for your ants that
takes the topography of the park, existing roads and the potential
crowding into account. Very steep slopes are hard to traverse, so your
planner may want to avoid them, whereas roads make it easy to walk, so
your planner may want to prefer them. However, hikers usually want to
enjoy pristine natural environment in a peaceful setting without
having a lot of other hikers around. While to certain extent they
still want to use trails others have found good, they want to
avoid too many human encounters in the nature. Your utility function
should also consider this. You can use the utility function for the
TSP problem as presented in Drťo et al. (2006, p. 130) as a
starting point.
Data
You are given two kinds of landscape information of the park: the
topographical map and the road map. This information is represented in two
two-dimensional grids of cells recording for each cell the steepness
of the slope and the existence of a road, respectively. The size of the
landscape is 195x189 (height x width) cells and each cell is 50x50 meters.
You can assume that the ant hikers move from cell to cell, i.e., the traveling
within a cell can be ignored.
Let the park entrance be in the cell (0, 0) [upper left corner] and
the monument in the cell (195, 189) [lower right corner]. Start with 200
ant hikers that enter the park simultaneously, and make them find their
way to the monument, then experiment with different numbers of ants.
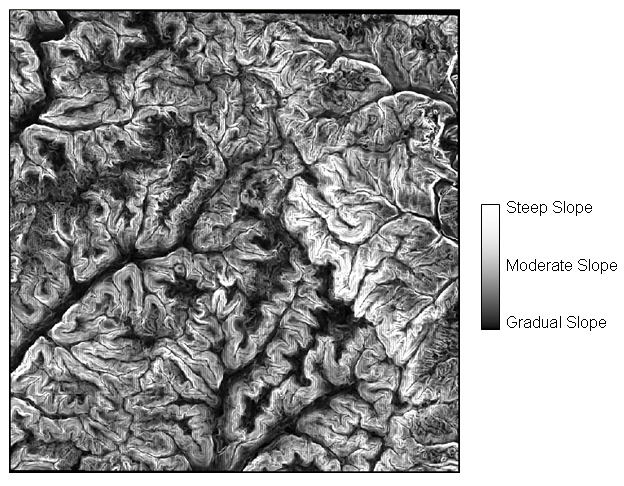
- Topographic map: the larger the number the
steeper the slope, zero means that the slope information is not
available (you can ignore it, or assume a gentle slope or flat
terrain). The topography looks like this.
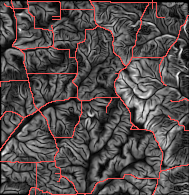
- Road map: 1 = a road is present in the
cell, 0 = no road exists, or road information not available. Here you can see how the roads are located on the
landscape.
Reporting the results
The task is two-fold — (i) designing a utility function, and
(ii) optimizing it using ant colony algorithms —, and your
report should reflect this. In order to describe the performance of
your optimization algorithm, you can report the effect of various
factors (parameters) to the utility score. More interestingly, in
order to illustrate your utility function, you can visualize the paths
chosen by the ant hikers.
For visualization purposes, you can use tools such as gnuplot, or
construct bitmap images. (Or if you are really enthusiastic, you can
create an animation.)
Hint: To easily produce bitmaps, you can use the PNM
format. Just write into a file, using the following format:
P3
189 195
255
100 100 100 80 80 80 20 20 20  0  0  0 ...
 90  90  90 50 50 50 20 20 20 30 30 30 10 10 10 ...
  .
  .
  .
The second line (189 195) gives the size of the image. The table
has a (R G B)-triplet for each pixel. You can let the color of the
pixel be determined by the number of ants passing through the
corresponding grid cell. For a nice visual impression, you can use
the slope values and/or the road map to create a background (see the
image showing the roads, above).