Algorithm Animation with Excel
Other Visualizations
Links
AAPS Home page | Eliot | Jeliot | Excel animations

Please, rename the file extensions from .bin to .xls after downloading the examples.
Bubble sort. While being one of the simplest sorting algorithms,
bubble sort is often used as an example in basic programming courses.
This demonstration uses the chart tool of Excel to visualize the changes
in an array while applying the algorithm.
Download Excel
5.0-7.0 version or
Excel
8.0 version
Binary search. Binary search is one of the most efficient search
methods (although it requires the data to be sorted). Our demonstration
visualizes the binary search algorithm while searching for a value given by
a user from an array. (The demonstration is explained in detail below.)
Download Excel
5.0-7.0 version or
Excel
8.0 version
Editing distance. Editing distance describes the number of basic editing
operations required to convert a string into another. It can be
computed with a method called dynamic programming. Our demonstration
uses 3-dimensional chart to illustrate this process.
Download Excel
5.0-7.0 version or
Excel
8.0 version
Factorial. This demonstration illustrates the use of a stack data
structure and recursion to determine a factorial of a given number.
Download Excel
5.0-7.0 version or
Excel
8.0 version
Huffman code generation. Huffman code is used in data compression. The
idea is to give frequent characters (or values) in the data to
be compressed shorter codes.
Download Excel
5.0-7.0 version or
Excel
8.0 version
Pairwise nearest neighbors. This demonstration visualizes how to
create clusters from a given set of vectors. this algorithm is applied
in image compression.
Download Excel
5.0-7.0 version or
Excel
8.0 version
Hashing. Hashing is a method to store data so that it can be retrieved
quickly. Each data unit has a key, which is used with a hash function to
locate the data unit. We present a visualization of a closed hashing algorithm.
Download Excel
5.0-7.0 version or
Excel
8.0 version
TSP. The
Euclidean Travelling Salesman Problem can be solved approximately by the
k-exchange technique. We present a simple visualization of 2-exchanges.
Download Excel file
All the phases of our approach are easy to carry out for even a novice in Computer Science familiar with the basics of Excel. Our approach is ideal for course assignments in many areas of Computer Science, and it can be applied even in research.
In its flexibility, the Excel approach to algorithm animation can be compared to Polaroid cameras: while the quality might not be the most refined, the quick results are practical even for unexpected purposes. And as Polaroid cameras, it is everyman's application: it works wherever Excel does.
There are three phases of creating an animation with Excel:

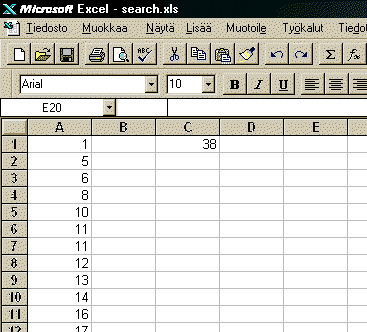
To animate this search algorithm, a chart which represents the array has to be formed. Let us assume that the array has 30 elements with non-decreasing values. The values are inserted in a normal Excel sheet to cells A1 through A30.

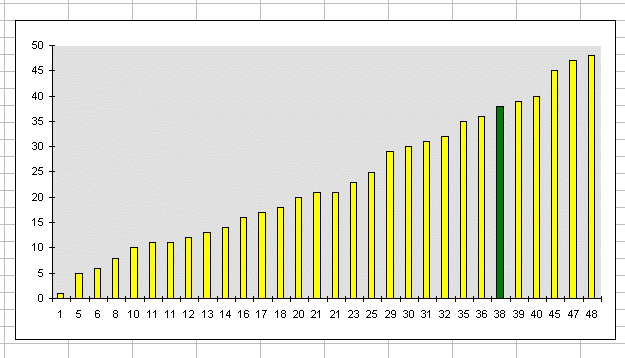
Then this range is selected and the chart wizard of Excel is applied to create a bar chart. Other chart types are also possible.

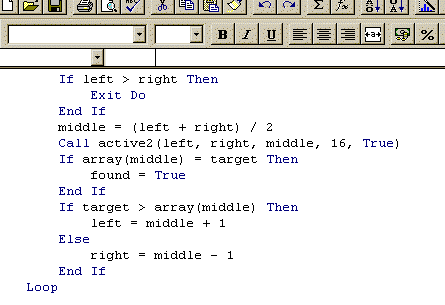
Besides forming a chart, the binary search algorithm is written in Visual Basic. The search and animation code is shown in Program 1.
Sub bin_search()
    Dim found As Boolean
    Dim a(30), target, left, right, mid As Integer
    target = Range("C1").Value
    found = False
    left = 1
    right = 30
    Do Until found
            If left > right Then
            Exit Do
        End If
        mid = (left + right) / 2
        call colorize(left,right,mid,16,true)
        If a(mid) = target Then
            found = True
        ElseIf target > a(mid) Then
            left = mid + 1
        Else
            right = mid - 1
        End If
    Loop

    If found Then
        Call Colorize(mid, mid, 0, 10, true)
    End If
End Sub
Sub Colorize(ByVal start As Integer, ByVal end As Integer, ByVal middle as Integer, color As Integer, clear as boolean)
  If clear Then
    ActiveSheet.ChartObjects("chart1").
    Chart.SeriesCollection(1).Interior.
    ColorIndex = 6
  End If

  For i = start To end
    If i = middle Then
      ActiveSheet.ChartObjects("chart 1").
      Chart.SeriesCollection(1).
      Points(i).Interior.ColorIndex = 3
    Else
      ActiveSheet.ChartObjects("chart 1").
      Chart.SeriesCollection(1).
      Points(i).Interior.ColorIndex = color
    End If
  Next
End Sub